ethereum ·
Ethereum Price Analysis: Key Levels to Watch as $2K Comes Into Play for ETH
Ethereum has slipped below a key technical boundary after failing to continue its recovery through the $2.8K region.
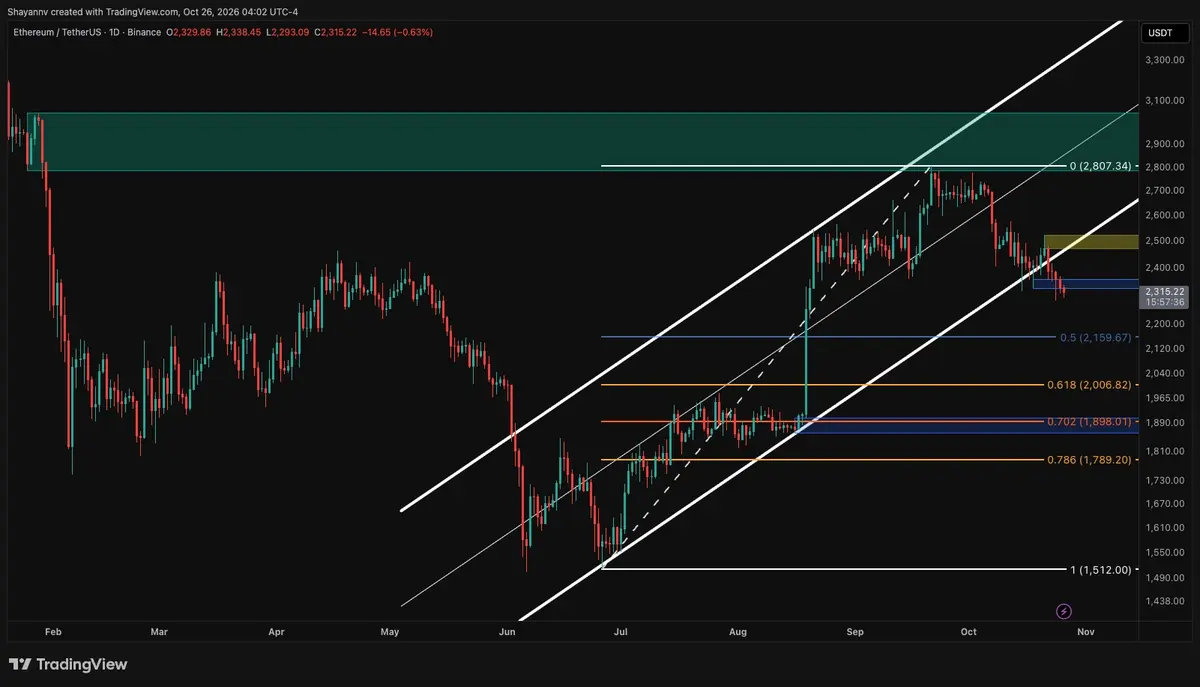
Trading around $2.31K, ETH has broken beneath the lower trendline of its daily ascending channel, putting pressure on the nearby support zone at $2.3K. Meanwhile, the Taker Buy Sell Ratio points to significant selling aggression in the futures market, reinforcing the cautious short-term picture. Ethereum Price Analysis: The Daily Chart On the daily timeframe, Ethereum had been advancing within a clear ascending channel since the late-June low near $1.5K.
The rejection from the $2.8K supply zone in September started a steady decline, and the price has now closed below the channel’s lower boundary around $2.4K. This breakdown suggests that the structure supporting the recovery has weakened considerably. ETH is also losing the small $2.3K–$2.35K support area, leaving the 0.5 Fibonacci retracement near $2.16K as the next notable reference.
Reported by cryptopotato.com.